The U.S. Economy & Stock Market: Charts That Captured My Fancy by Stephen Aust, MarketCycle Wealth Management
I started by looking at 1,000,000,000 charts in a zillion financial articles that I read during the past three months; I found hundreds that captured my attention but was able to narrow the number down to the 30 that truly caught my fancy…
Posted on December 15, 2015.
And we’re off:
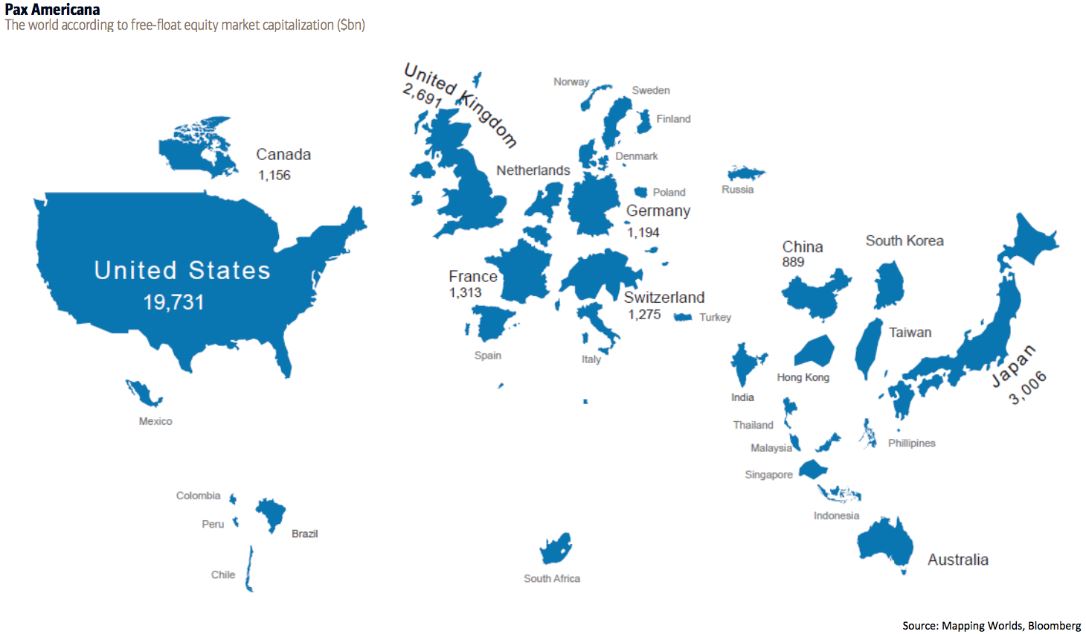
Each country’s size shown by the size of its actual economy… the U.S. economy almost matches the entire rest of the world combined:
Investors are still afraid of stocks and are still selling more than they are buying, which is very bullish going forward since these same investors will slowly come back into the stock market:

The U.S. stock market Forward Price to Earnings Ratio has a long way to go before the stock market will be considered over-valued:
Inflation is expected to remain low (lowflation) and this will eventually be recognized as a strong plus for the economy:
One of the biggest worries amongst investment professionals has been the un-founded fears around possible high-yield junk bond defaults, but despite a very recent drop in price, junk bonds are still fairly safe (with an historically low default rate), especially the “senior-loan” category (which is mostly comprised of developed market floating-rate loans and containing fewer energy company loans):
Holding periods for stocks continues its decent as modern adults suffer from ever increasing levels of Attention Deficit Hyperactivity Disorder. When I was born, stocks were held for an average of 5 years and now the holding period is less than 5 months:
Hedge fund correlation to stocks is so close to an exact match that many of them no longer offer any diversification or downside protection or hedging benefit (and they charge excessively high fees):
Despite hedge funds doing worse, selective smart-beta (IE: momentum) can actually enhance portfolios. (Courtesy of SeekingAlpha):
The SEC is continuing to crack down on the use of leverage in ETFs (Enlarged snippet taken from a CNBC video):
U.S. corporate profits continue to climb strongly:
The U.S. jobs data is looking strong (Courtesy of Business Insider):
Companies plan to raise wages in the United States:
Retail sales continue to remain strong and this means that the consumer, which is (historically) 70% of the economy, also remains strong (Courtesy of Daily Shot):
According to the U.S. Federal Reserve, the chance of a recession (and a >20% stock market drop) during the next two quarters is only 1%:
Health care costs continue to rise far beyond the growth in inflation… AND, of course, health care in most of the world is merely symptom treatment rather than actual “health” care which is why so many people are so chronically un-healthy:
Historically, the U.S. stock market has performed well after the initial frightening Fed interest rate hike is behind us:
Terminating 0% interest rates:
Globally, how much money (in $-billions) has flowed into money-market funds and stocks and out of bonds over the past six months? The answer is shown below, but eventually, much of the cash (money-market funds) will flow into stocks (Courtesy of Business Insider):
Monetary policy in Europe and Japan is especially accommodative and this should help to prop up their stock markets:
The number (percent) of countries holding their interest rates near an accommodative zero-% is currently at record highs:
As MarketCycle has been saying for several years now, the U.S. Dollar rules supreme as other currencies continue their slide (Courtesy of Pension Partners):
According to the Bank for International Settlement’s Debt Service Ratio, developed countries (IE: U.S. and Europe and Japan) have beneficial low debt servicing costs (the red line) while emerging countries (IE: South Africa and Brazil) have record high debt servicing costs (the blue line). Chart courtesy of Business Insider via BIS:
Because U.S. Treasuries pay so little interest, foreign countries have backed off of buying U.S. Treasuries… another sign that the 30 year bull market in fixed-rate bonds is over (this money is likely to slowly move into the stock market):
The velocity of money is picking up as developed market banks continue to loan to corporations and individuals, which is bullish for the corresponding economies:
As I keep saying, China is a mess and with no signs of improvement… their corporations are going deeper into debt just to pay the interest on the debt that they have previously taken on:
In the United States, since 2010, the majority of homes that have sold have become rental properties:
There is little chance of commodities moving higher on a long-term basis since the oil glut is getting worse, not better, and the U.S. Dollar is getting stronger, not weaker. Both conditions are good for consumers but bad for emerging market stocks and energy/materials stocks. (Source: CNBC):
MarketCycle has been almost alone over the past three YEARS in saying that oil would fall into the mid to lower $30s! Emerging markets produce commodities and are therefore just as weak as is the commodity of oil… E.M. stocks are shown in red (and OIL in black) on this 15 year price chart:
U.S. stocks year to date… being below the horizontal red/green line means that the stock market is down for the year (posted on Wednesday open on December 15, 2015):
Opening headline on CNBC (12/15/15) from Jeffrey Saut… very bullish view suggesting record highs within three weeks:
In the United States, the state and local tax burden is shown in this interesting chart… dark blue states have a high additional tax burden (the color does not reflect quality of life or even amenities):
;-}
I’d like to close with this message that I used to repeat endlessly to my patients: In order to continually have health, we must continually do those things that create health:
Thanks for reading!


