
Today’s unemployment that featured above trend employment growth, a tick up in the participation rate, a flat unemployment rate and a little less wage growth compared to last month is being met with applause from the equity market. After all, it was last month’s surge in hourly earnings that was blamed for the speedy equity and bond market correction, something this report visibly lacks. But, just because we didn’t get another surge in earnings this month doesn’t mean it isn’t coming. Indeed, numerous indicators that lead wage growth by about a year are signaling an acceleration in wage growth in the coming months. Some of those indicators that lead wage growth include the unemployment rate, small business hiring plans, and the output gap. We’ll take them one-by-one below.

Check out our H2 hedge fund letters here.
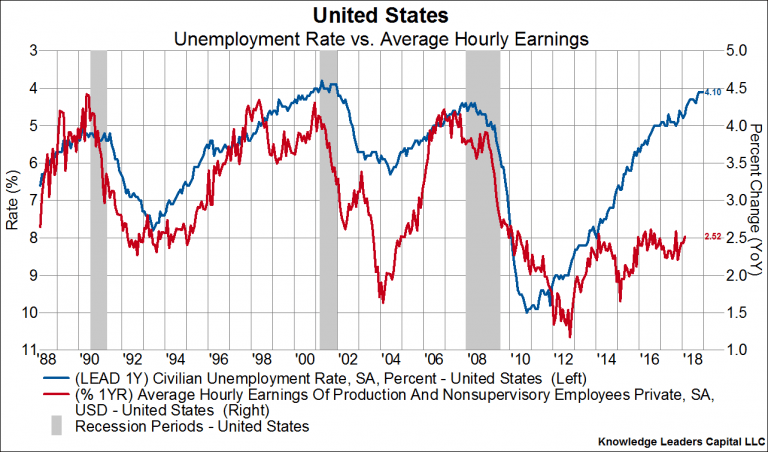
The first chart below shows the unemployment rate (blue line, left axis, inverted) plotted against average hourly earnings of non-supervisory employees (red line, right axis). The unemployment rate leads wage growth by about one year, and the break lower in the unemployment rate that started in early 2017 looks set to feed through to wages in the coming months.
Next, we show the relationship between NFIB small business hiring plans (blue line, right axis) and wage growth (red line, left axis). Small business hiring plans lead wage growth by about fifteen months, so the breakout in those hiring plans that started in early 2017 suggests an uptick in wages in the coming months.

This third chart compares wage growth (blue line, left axis) to the output gap (red line, right axis). The output gap measures whether an economy is operating below, at, or above potential growth. A positive output gap (something that occurred beginning in early 2017) is an indication that the economy is running at a faster pace than it is able without igniting some pricing pressure. The output gap leads wage growth by about five quarters, and its recent uptick portends higher wages in the coming months.
So, while this latest employment report is rather unoffensive in every way, we should be careful to not extrapolate this sort of not to hot, not to cold type of reading.
Article by Bryce Coward, CFA - Knowledge Leaders Capital


