For weekend reading, Gary Alexander, senior writer at Navellier & Associates, offers the following commentary:
Now that we are entering the heart of earnings season, investors will “follow the money” of first-quarter corporate earnings and revenue reports, along with their best projections for future quarters. Everything depends on the bottom-line profits a company can deliver. How different this is from the political world.
Axios reported that math proficiency in Washington DC public schools, grades 3-12, decreased from an abysmal 31% in 2019 to a thoroughly rotten 19% in 2022, partly due to COVID closings.
But it’s even worse in nearby Baltimore, where the Maryland Comprehensive Assessment Program (MCAP) revealed that 23 elementary, middle, and high schools couldn’t find even one student able to do math at grade level.
Those serving in Congress can’t do much better if you go by recent pronouncements and actions. Let me give you just four examples that aren’t much in the headlines yet but will be big news by year’s end. They cover the most important financial challenges we face – deficits, inflation, jobs, and the dollar.
Math myth #1: We’re reducing the deficit.
In his 2023 State of the Union address, President Biden said, “In the last two years, my administration has cut the deficit by more than $1.7 trillion – the largest deficit reduction in American history,” and, looking forward, he added, “I just signed a law to reduce the deficit by $114 billion by cracking down on wealthy tax cheats.
That’s being fiscally responsible.” Those are a couple of Whoppers. It’s true that the post-COVID tax windfall brought in record tax receipts, but also record spending, so the deficit was lower than during COVID, but here’s the truth for this Fiscal Year:
- In the first half of Fiscal Year 2023 (October 1, 2022, to March 31, 2023), total federal spending rose by 13%, but revenues decreased 3%, resulting in a $1.1 trillion deficit (a $2.2 trillion annual rate), according to the U.S. Treasury. The rush in new spending resulted in large part from the inflationary Cost of Living Allowance (COLA) for Social Security (+10%) and Medicare Spending (+14%), but especially the 41% increases in the cost of servicing the national debt, due to the Fed’s rate increases.
With that in mind, Congress faces a debate on raising the debt ceiling this June. They better get realistic about their deficit math equations by then, or we’ll hear a chorus of “June is Busting Out All Over.”
Math myth #2: We’ve licked inflation, so let’s move on.
The March Producer Price Index (PPI) was particularly soothing – down 0.5% in March and up only 2.7% in the past 12 months – pretty close to the Fed’s 2% goal – but alas, that number is backward-looking. Instead, let’s look at this April Fool’s Joke:
- On April 1, OPEC+ cut their combined crude oil production by 1.2 million barrels per day, and the price of crude oil quickly rose 9.3%, from $75.67 to $82.68 per barrel in two weeks.
- Gold shot up to near a record high, up 2% in April and silver is up 6% in April to $26 per ounce.
- Sugar prices are at a 10-year high, up 20.5% so far this year, through last Friday.
In addition, the Biden EPA has virtually guaranteed a huge rise, perhaps doubling, of the minerals needed for electric vehicles (EVs) and their batteries.
Cobalt (70% coming from the Congo, often from small, hand-dug mines by children), lithium (60% from China), and copper (40% from Peru and Chile, and 47% of the smelting coming from China). These are not stable sources, and the demand will be super-high.
Commodity price inflation could revive soon. If so, the PPI will soar, followed by an equivalent surge in the CPI. This will catch politicians and the Fed by surprise, just as the “transitory” inflation of 2021 did.
Math myth #3: The jobless rate is at an all-time low.
The U.S. unemployment rate hit a 53-year low of 3.4% in January 2023 and it has been under 3.8% for over a year now, but that number only counts those “looking for a job” who allegedly can’t find one, even though over 10 million listed jobs were going unfilled during that time, unclaimed jobs. (That total is available in the JOLTS report each month).
February’s open job listings, according to economist Ed Yardeni, were in professional & business services (1.8 million), health care & social assistance (1.7 million), leisure & hospitality (1.5 million), retail trade (829,000), state & local government ex-education (535,000), transportation, warehousing & utilities (488,000), financial activities (476,000), durable goods manufacturing (475,000), and construction (412,000).
But the Labor Force Participation Rate, at 62.6%, remained below its pre-Covid 63.3% rate, as men of working age have been dropping out of the Labor Force for decades – particularly since 2008, mostly due to alternative living arrangements and the rising array of benefits available for not working.
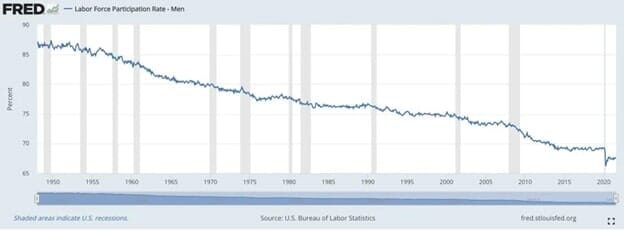
Businesses all over America need help, but workers don’t want those jobs. How can there be a recession when jobs go begging? Until we reduce rewards for not working and value work, this trend will continue.
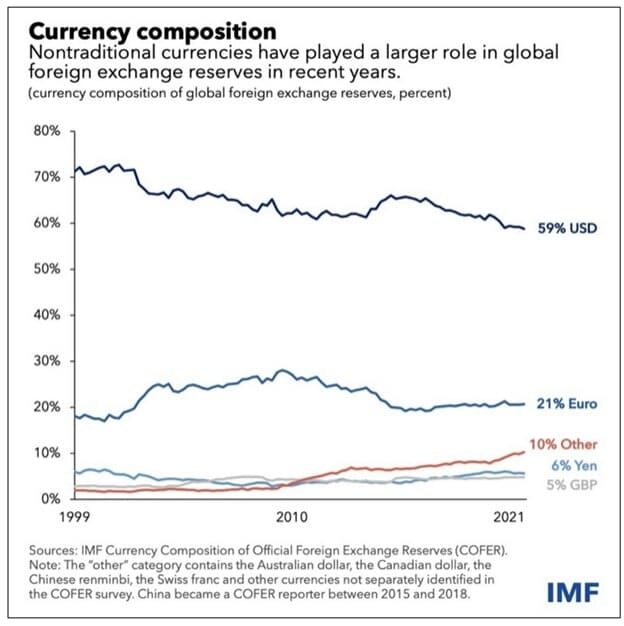
Math myth #4: The dollar is doomed.
But compared to what? With currencies, it’s always a beauty contest, or rather a “least ugly” contest. Einstein’s Theory of Relativity applies. What paper money is better managed than the other guy’s paper? The dollar may be over-printed, at the moment, but compared to the euro, yen, yuan, British pound, and other contenders, who manages their paper currency better?
In a greater sense, the world’s leading currency usually reflects the world’s strongest nation. As Dennis Gartman used to say at the New Orleans Investment Conference, “The U.S. has 11 aircraft carriers. China has just one. That’s why the Dollar is King.”
Alas, his math no longer applies, as China is catching up fast in the Naval department, but that gain comes at a great cost. China’s debt-to-GDP ratio exceeds ours, if you count all their ambitious off-the-books military expansion and Belt and Road managed economic projects.
The Economist reminds us (this week, in “Riding High”) that “America’s dominance of the rich world is startling. Today it accounts for 58% of the G7’s GDP, compared with 40% in 1990. Adjusted for purchasing power, only those in über-rich petrostates and financial hubs enjoy a higher income per person.
Average incomes have grown much faster than in western Europe or Japan. Also, adjusted for purchasing power, they exceed $50,000 in Mississippi, America’s poorest state—higher than in France.”
The Economist continues: “American firms own more than a fifth of patents registered abroad, more than China and Germany put together. All of the five biggest corporate sources of research and development (r&d) are American; in the past year, they have spent $200 billion.
Consumers everywhere have benefited from their innovations in everything from the laptop and the iPhone to artificial intelligence chatbots. Investors who put $100 into the S&P 500 in 1990 would have more than $2,000 today, four times what they would have earned had they invested elsewhere in the rich world.” That’s why the dollar still rules!
The lesson is clear to investors – don’t give up on America. Keep investing in home-grown companies.