
Jeffrey Gundlach‘s webcast slides for the month of January, 2018, in which compares the Fed dots vs market expectations from 2018 with 2019.
TAB I
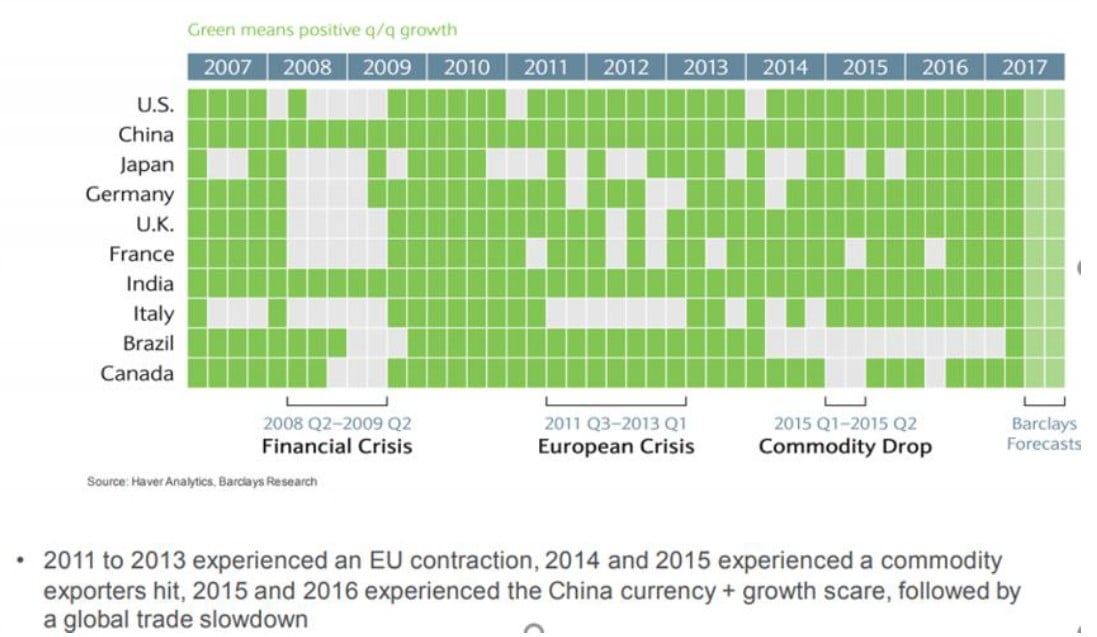
World Growth in Sync
EU = European Union. q/q = quarter-over-quarter. You cannot invest directly in an index.
[REITs]Q3 hedge fund letters, conference, scoops etc
Central Bank Balance Sheets vs. MSCI ACWI
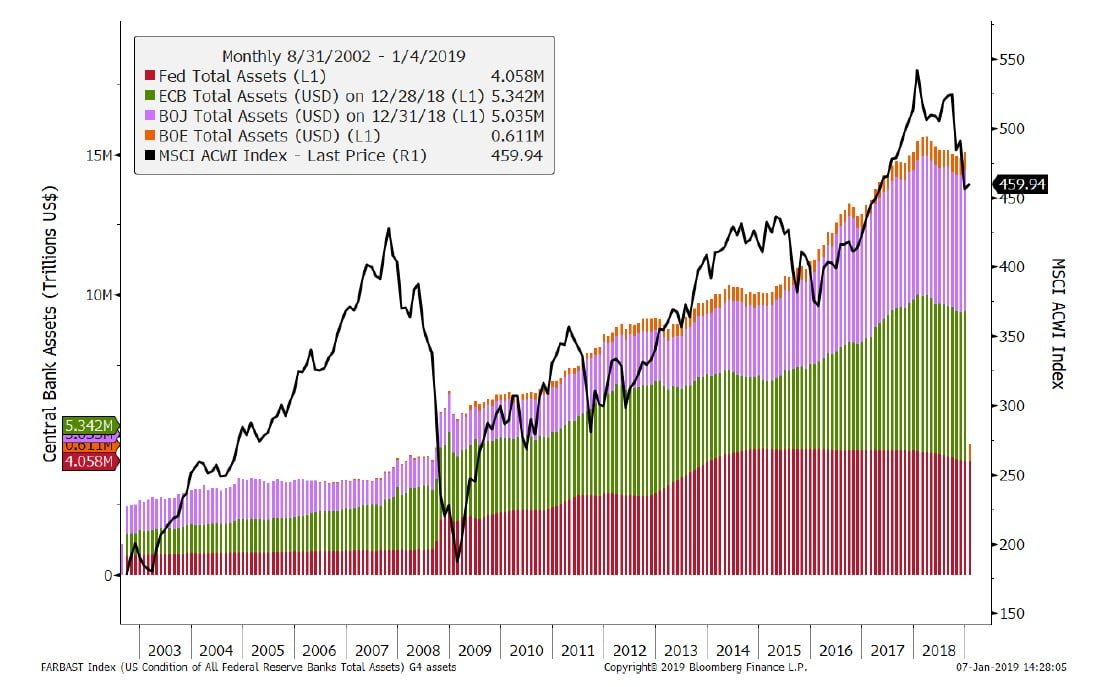
Source: Bloomberg, DoubleLine
MSCI ACWI = A market-capitalization-weighted index designed to provide a broad measure of stock performance throughout the world, including both developed and emerging markets. BOJ = Bank of Japan, ECB = European Central Bank, Fed = Federal Reserve. BOE = Bank of England.You cannot invest directly in an index.
“The Year No One Made Money”
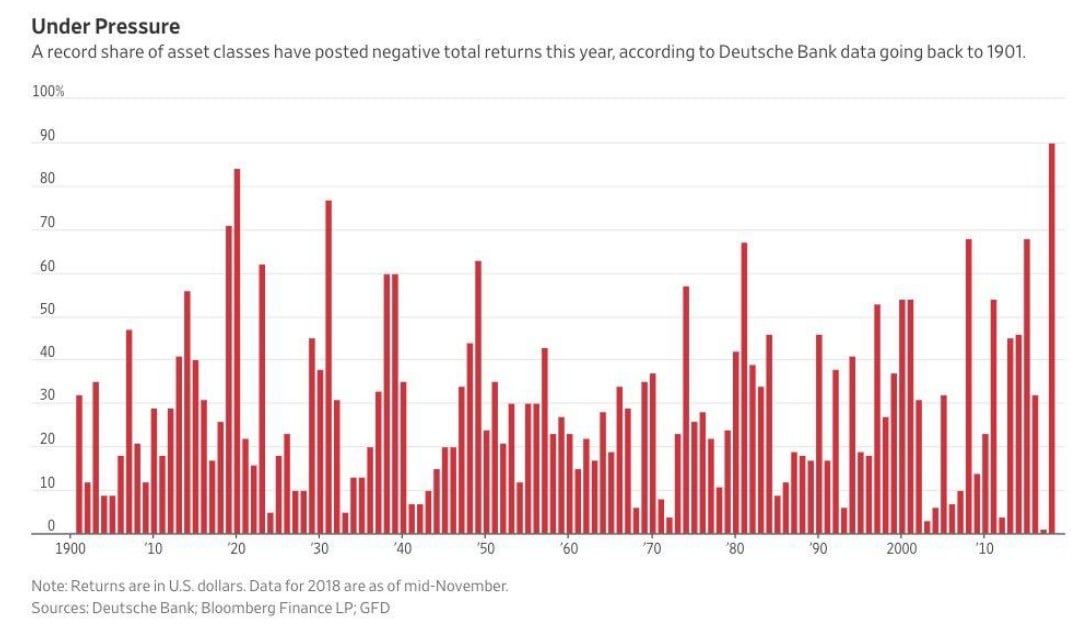
Source: The Reformed Broker “The Year No one Made Money” 11-25-18
Universe is comprised of 71 asset classes: 30 equities, 30 bonds, 5 commodities, 4 credit, 1 home price and cash. YTD excludes home prices.
Fed Funds with Shadow Rate and Fed Balance Sheet
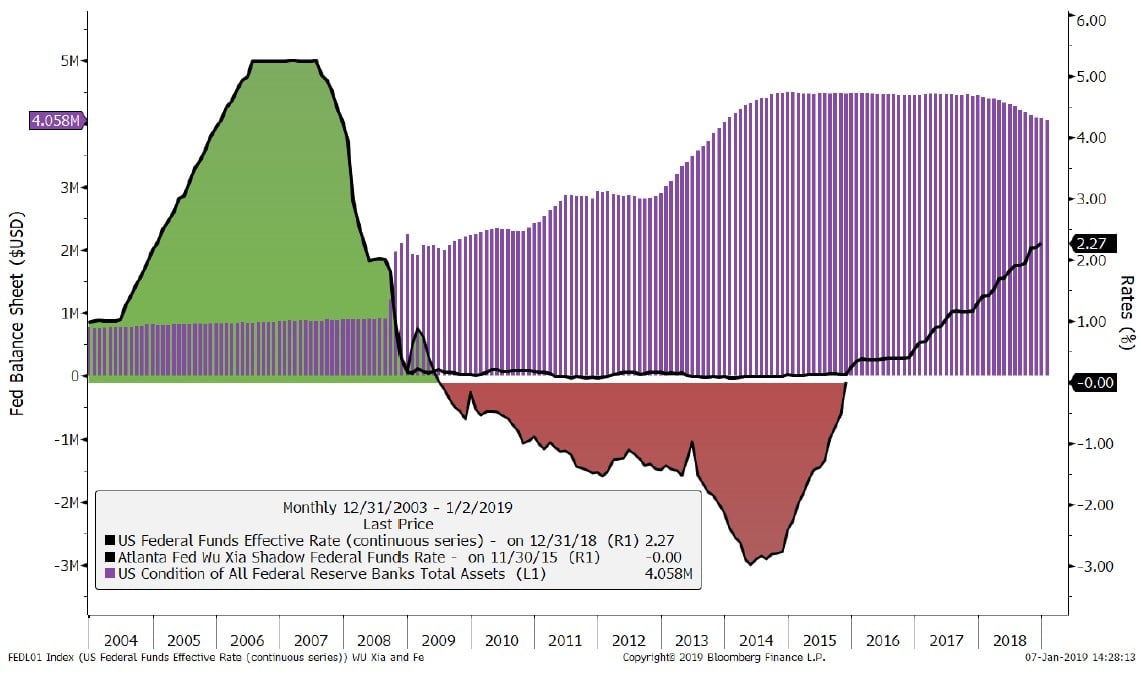
Source: DB Research, Bloomberg
Fed Dots vs. Market Expectations 2018 and 2019
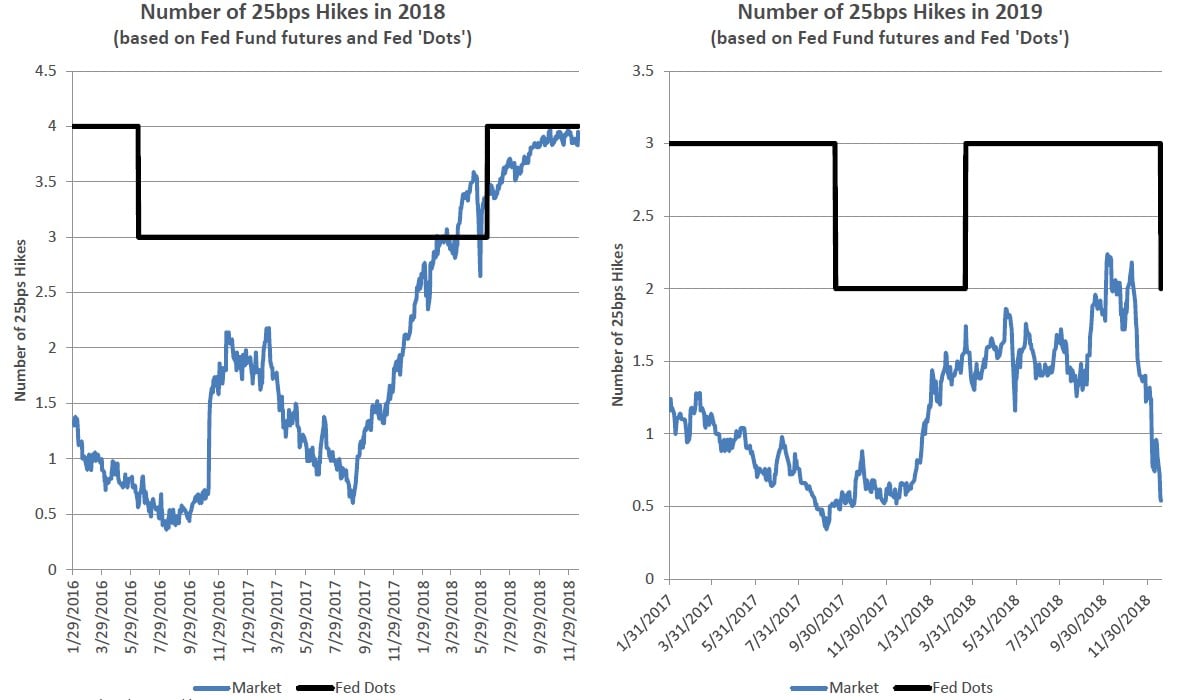
Source: Bloomberg; DoubleLine
The Dot plot is a survey of Federal Open Market Committee members expectations for future policy. Market participants belong to CME Group.
December Survey – Global Economic Weakness
As of December 19, 2018
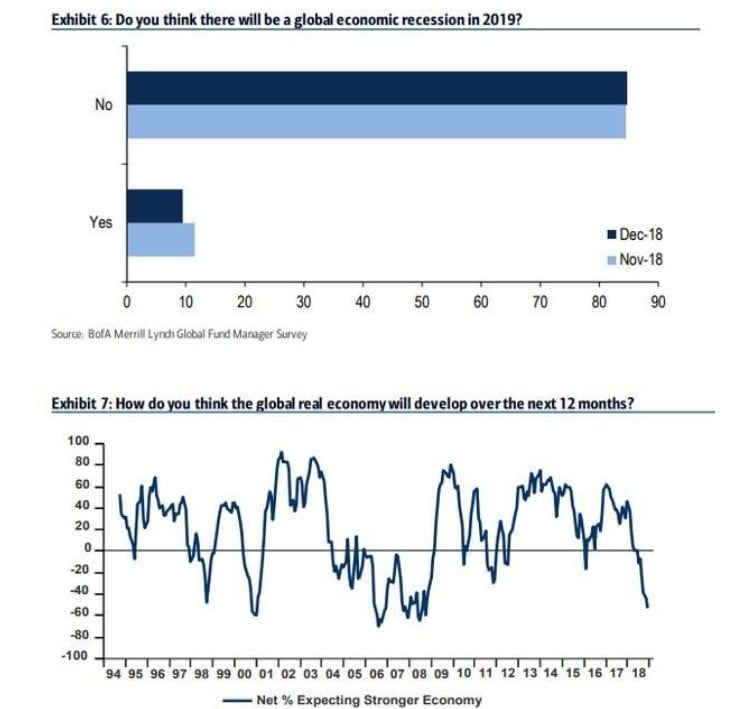
- Only 10% of respondents think there will be a global recession in 2019
- Yet the lowest net percentage of fund managers since 2008 think real global growth will improve in the next 12 months.
Source: BofA Merrill Lynch Global Fund Manager Survey
Merrill Lynch BofA fund manager’s survey canvasses and views 200 institutional, mutual and hedge fund managers.
KOSPI Indicate Strong Global Economy
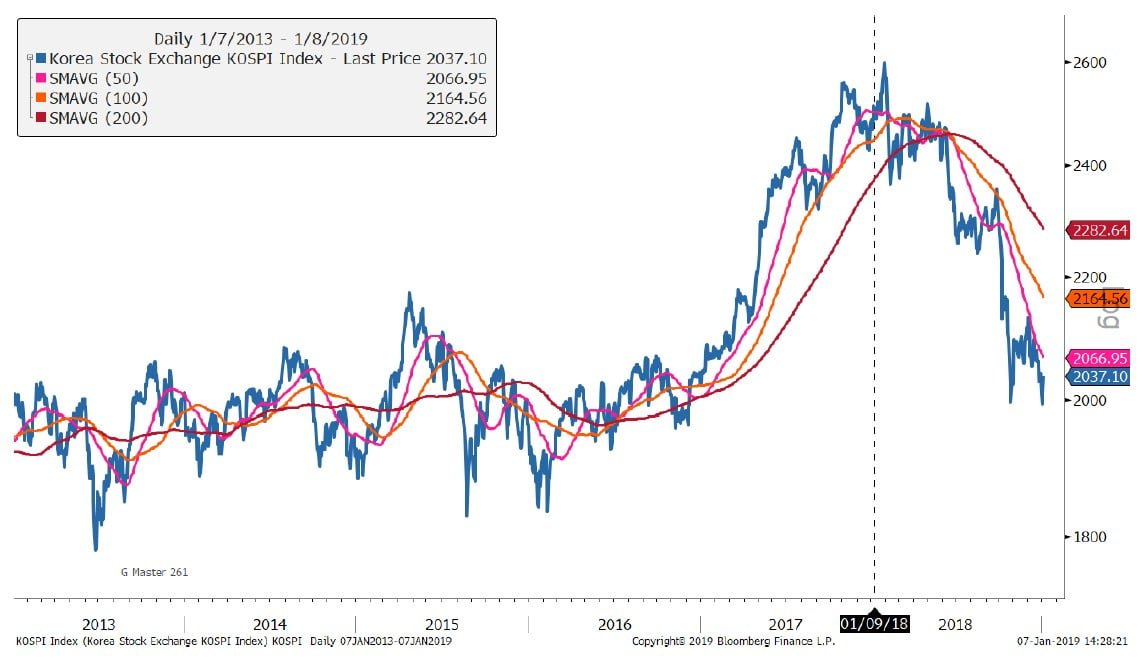
Source: Bloomberg, DoubleLine
KOSPI Index is a capitalization weighted index of all common shares on the Korean stock exchanges. SMAV = Moving average for days indicated. You cannot invest directly in an index.
Economic Data Change: U.S., Global, Europe, and Emerging Markets
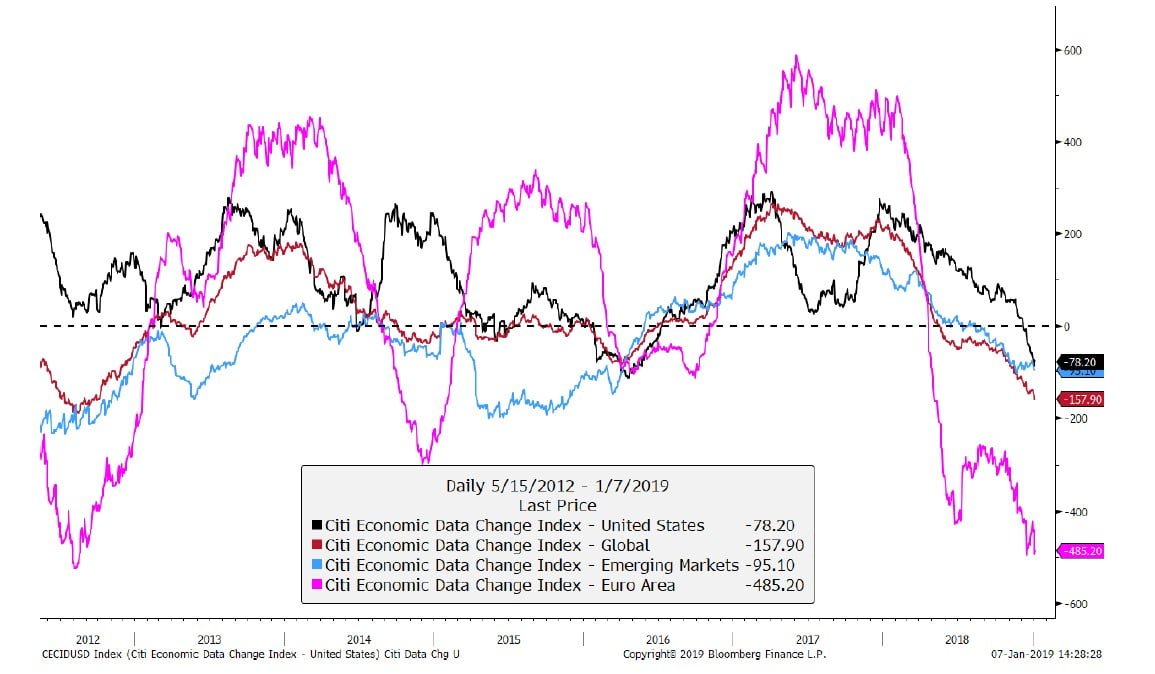
Source: Bloomberg, DoubleLine
U.S. Housing and Real Estate Market Economic Data
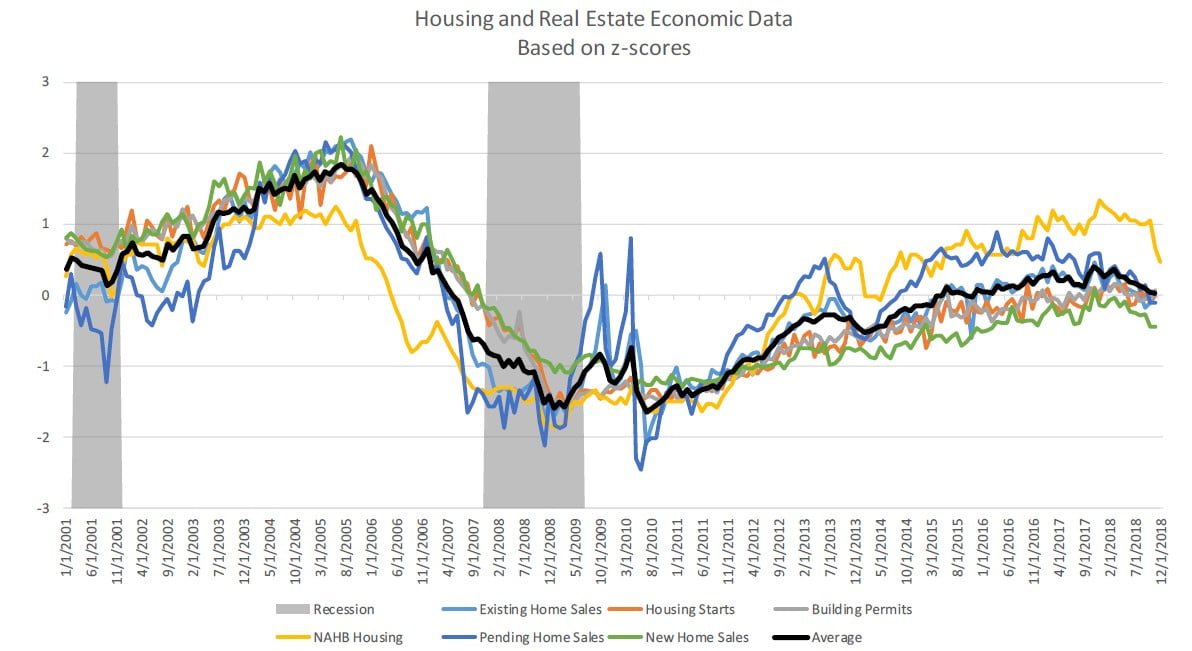
Source: Bloomberg, DoubleLine
NAHB = NAB/Wells Fargo Housing Market index is based on a monthly survey of members belonging to the National Association of Home Builders. Z-Score is a numerical measurement of a value’s relationship to the mean in a group of values.
The Conference Board Leading Economic Indicator
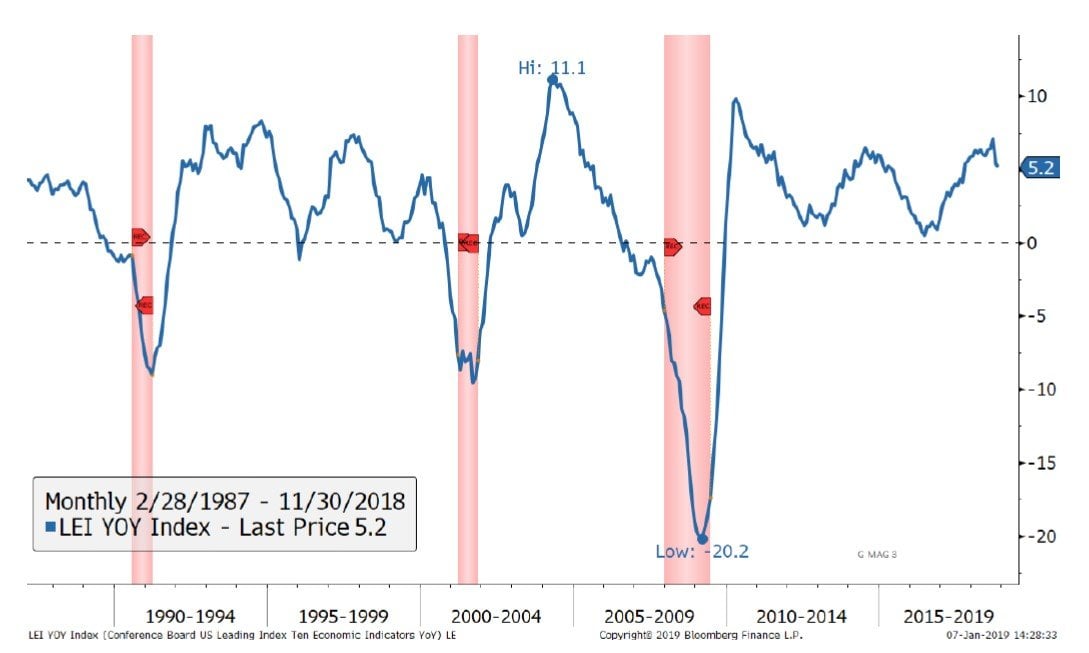
Source: Bloomberg, DoubleLine
Conference Board U.S. Leading Index = Leading indicators include economic variables that tend to move before change in the overall economy. These indicators give a sense of the future state of an economy. YoY = year-over-year. Red shading indicates recessionary periods. You cannot invest directly in an index.
See the full slides below.


