
Farnam Street Investments commentary for the month ended October 2021, titled, “Cranking the Amplifier to Eleven.”

Q3 2021 hedge fund letters, conferences and more
“Never underestimate the power of stupid people in large groups.” - George Carlin
You probably have good taste in music. At least we all think we do. But why do you like certain songs and not others? Is it possible your preferences are swayable?
The research says yes. Matthew Salganik and his coauthors crafted a large-scale study of music downloads. They designed a website where people could hear and download one or more of seventy-two songs by new bands. In the control group, participants were kept in the dark about which songs were popular.
The researchers then created eight groups where visitors could see popularity based on downloads of others in their group. With eight separate versions of “history” running, you’d expect to see the good songs rise to the top, while the bad would sink to the bottom. There’d be no noise--meritocracy would sort wheat from chaff in all eight cohorts.
Yet the researchers found the group rankings varied greatly. Early random popularity would propel a song to the top of the charts. It’s slightly comforting that the best songs (as based on the control group) were never dead last, and the worst never rose to the absolute top. But otherwise, anything could happen.
Salganik and coauthors crafted a clever follow-up experiment. They inverted the initial rankings from the control group. Participants now saw the least popular songs as the most popular, and vice versa. With that subtle initial nudge, the “worst” songs became very popular and the “best” songs did poorly.
As Daniel Kahneman summarized the study in his book Noise: A Flaw in Human Judgement, “social influences create significant noise across groups.” << Twitter has entered the chat. >> Researchers identify two key issues to explain how groups amplify noise: informational cascades and group polarization. We’ll tackle both in a bit, but first we must ask a broader question:
Why are groups of humans often so bad at decision-making?
To answer this question, let’s rewind the clock all the way back and observe the historical sweep of communications.
Homo Fabula (Man, the Storyteller)
Dinosaurs ruled the earth for 165 million years. The current iteration of our species has been around for just two. We’re still young and figuring some things out.
For the vast majority of our evolution, we’ve communicated contemporaneously, in the flesh, face-to-face. We told each other stories describing how we thought the world worked. Typically information flowed down the gradient from old to young. “There’s a watering hole over that hill, but watch out for the lions behind the pile of rocks. And mind that dark cloud... the thunder gods are angry today.”
These stories generated mental models to better anticipate our environment and move our genes to the next round. Our messages didn’t necessarily have to be true. Nor did we need to fully understand the arrows of causation and correlation. They just had to increase our odds of survival.
One theory holds that we developed large brains in order to gossip. We had to figure out who was cool and who was a jerk. Or said more academically, we conducted dynamic hierarchical sorting and monitoring. Figuring out our place in the tribe to prevent exile (which was a prehistoric death sentence) was of paramount importance.
Additionally, group work inherently invites parasitism. A free rider can do less than their share and still enjoy the fruits of the group’s effort. It required a bigger brain to keep score and track all the social dynamics of a typical one-hundred-person tribe.3
Just as the ocean molds boat design, environments generate adaptive pressures which mold genetic expression. Think of the long beak on one of Darwin’s finches used for picking seeds from deep inside a plant. That pressure also molds cultural adaptation. Our early stories were the transmission of culture from one generation to the next, a supplement to our genetic instincts.
But it was all so provincial. We communicated via words (grunts?), intonation, body language, pheromones, and gift-giving. The messages were real-time and location dependent, bound by the range of the human voice.
And then a funny thing happened. About five thousand years ago, the Sumerians started making small notches on clay tablets and kicked off a process that would radically alter humanity. This notching system was called cuneiform, and humans could now transmit ideas, information, and stories across both time and space. Assuming I could read cuneiform, I can receive messages from a fellow human separated by 7,500 miles (California to Iraq) and 5,000 years.5
Simply remarkable.
Summary
To summarize: for 99.75% of our evolution, all complex ideas were transmitted verbally through storytelling. For only nine inches on the 100-yard football field of humanity have we employed written language. Our brains are still playing catch-up to more than just gossip and weather.
For the next 4,500 years, everything was basically written by human hand. It was painfully slow and expensive for scribes to “print” books. The speed and cost of communication was choked by the human hand. Then in Germany around 1440, Johannes Gutenberg invented the printing press, dramatically lowering the cost of transmitting culture. Little wonder the pace of cultural progress revved. One theory of the cause of the Cambrian explosion 500 million years ago was the rise in planetary oxygen levels,6 boosting the potential vitality of animals. To push the analogy, the printing press increased humanity’s cultural oxygen. A fresh vibrancy burst forth.
Fast forward 400 years or so. In 1844, Samuel Morse famously “texted” the first message over a telegraph: “What hath God wrought?” By 1876, Alexander Graham Bell had placed the first phone call. The constraints of geography in real time communications were fully obliterated.
In 1896, Guglielmo Marconi patented the radio. In 1927, Philo Farnsworth successfully demonstrated the television. We could now transmit both audio and visual images from one-to-many. Due to the constraints of the electromagnetic spectrum, there was only so much space available for separate channels. This choke point created a consumer packaged goods ecological niche where large national brands flourished. Household names like Kraft, Crest, and Coca-Cola had the scale for nationwide advertising to build their brands. These brands could then charge premium prices to build CPG empires.
The next big development was the transistor in 1947, which led to computers, and eventually the internet. That digital story is still playing out today. Next stop, into the metaverse. The unconstrained capacity of internet bandwidth (as opposed to only having space for NBC, ABC, and CBS), has fragmented communication and attention.7 The proliferation of communication tools has been, well... prolific. Email, text, phone call, video chat, DM, slack, instant messenger, tweet, post, snap, pin, blast, spam… you get the idea.
A Flood
The spectre of caloric starvation stalked humanity for eons. We find ourselves suddenly drowning in a flood of information that is a new threat to our mental health.
A UC San Diego study found we are inundated with the equivalent of 35,000 megabytes of information every day. Yet in 2020, our species created something like 1.1 trillion megabytes per day.
Very roughly speaking, that means we’re only accessing .00000318% of the new information.8 And we aren’t consciously processing anything near that rate. The human body sends roughly 11 million bits per second to the brain for processing. Yet the conscious mind seems to only be capable of processing around 50 bits per second. Consciousness is shockingly low throughput; there’s a lot always happening under the covers.
Suffice it to say, our sensory perception is a tiny keyhole into the world. We evolved for an information desert. We find ourselves cast adrift in a vast informational ocean.
Through this tiny keyhole, we construct our sensory inputs into “reality.” No wonder there’s so much disagreement and strife. As we’ll see, we’re like so many proverbial blind men touching an elephant.
If you make it to the end of this letter, you’ll see that technology might just save us from this predicament. But only if we’re thoughtful in how we use it.
MAPping the Elephant
Stop me if you’ve heard this one: six blind men encounter an elephant for the first time...
The first touched the elephant’s side and declared, “He’s exactly like a wall!”
The second felt the tusk. “It’s hard, smooth and sharp like a spear.”
The third touched the trunk and described it as a snake.
The fourth grasped the leg and observed it as a tree.
The fifth found the ear to be a fan.
The sixth pulled the tail and said it had to be a rope.
The six blind men spent the rest of the day arguing with each other, believing to their cores that they alone possessed the One Truth™. They were right in their individual assessments, yet couldn’t have been more wrong.
Given all the noise and our pinched perspectives, how can we make better decisions?
I put forth three tactics: MAP, Correcting Predictions and something I’m calling “Decision Voltron.”
Reading the MAP
Daniel Kahneman describes a process called Mediating Assessment Protocol (MAP). In the most basic terms, here’s how it works: As a group, figure out the most important elements of the situation. Independently score each of those away from the group. Share your results, and talk through why you scored each item a certain way. Run another assessment. Aggregate the scores for an overall decision.
It’s an implementation of several decision hygiene techniques: sequencing information, structuring the decision into independent assessments, using a common frame of reference ground in the outside view, and aggregating the independent judgments of multiple individuals.
Kahneman’s description of the main steps of the Mediating Assessment Protocol:
- At the beginning of the process, structure the decision into mediating assessments.
- Ensure that whenever possible, mediating assessments use an outside view.
- In the analytic phase, keep the assessments as independent of one another as possible.
- In the decision meeting, review each assessment separately.
- On each assessment, ensure that participants make their judgments individually; then use the Estimate-Talk-Estimate method.
- To make the final decision, delay intuition, but don’t ban it.
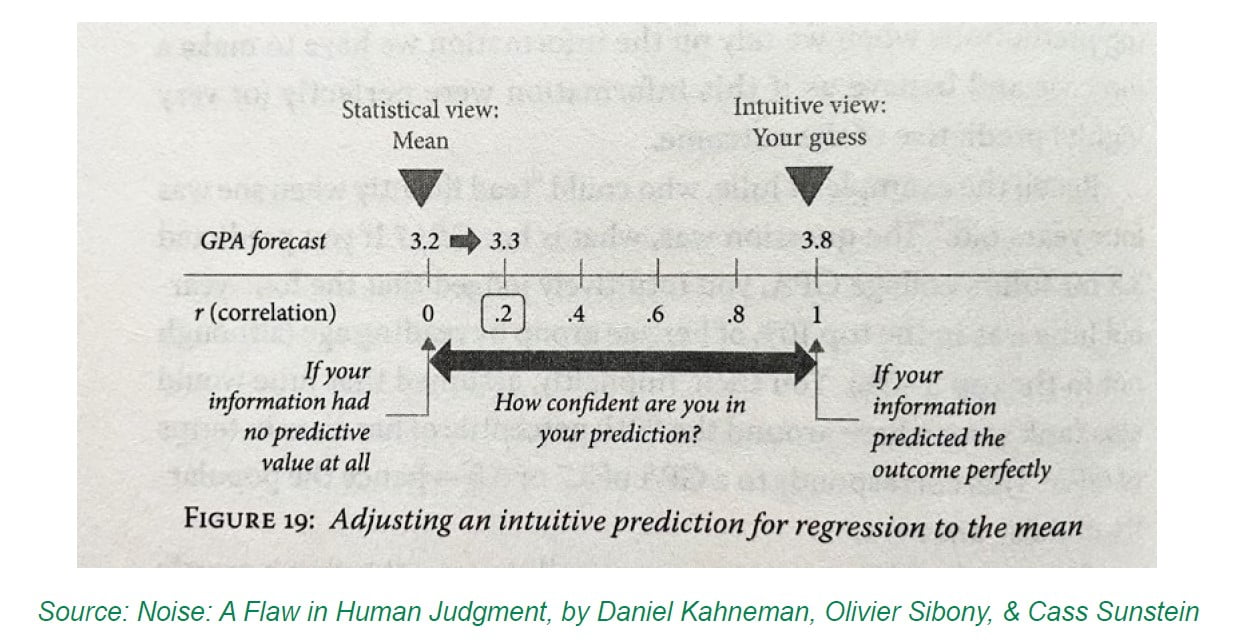
Source: Noise: A Flaw in Human Judgment, by Daniel Kahneman, Olivier Sibony, & Cass Sunstein
Kahneman’s MAP approach works because it balances competing factors.
First, blindspots are legion when you only have access to your singular keyhole. We can miss big, obvious facts that lead to catastrophic errors. There’s a story of a man who bet on horses. He knew everything about the horses, the jockeys, the tracks, the weather. He wagered his entire fortune on a particular horse that was a lock to win. Just as the race was starting, a friend informed him that his horse had a broken leg.
Decisions in an absolute vacuum are inherently dangerous. We lack what psychologists call the “outside view.” Yet being influenced by others is just as dangerous. Recall the chaotic online music experiments. We suffer from two primary phenomena: information cascades and polarization.
Information cascades explain how groups start to think alike. A persuasive, likeable, or smart person shares their opinions with the group first, biasing the rest to see the world in a similar way. Social dynamics also play a part. Lower-power individuals don’t want to be seen as non-team players, so they defer comment or withhold information from those with higher power. The group loses the individual objectivity that underpins the wisdom of the crowds’ hypothesis. Blindspots run amok.
Group polarization is the basic idea that when groups of people work together, they often end up at an extreme position compared to their original inclinations. Group enthusiasm creates more confidence, unity, identity, and extremism. Studies of juries making punitive damage awards in product liability cases show that group discussions lead to larger dollar amounts than when individuals assign their own awards for damages. One study found 27% of juries awarded a higher amount than even the most severe single member’s punishment. Whether you vote red or blue, it’s uncontroversial at this point to observe how group polarization is impacting politics in the U.S. for the worse.
We miss “broken legs” when deciding by ourselves. We are heavily influenced by others when deciding together. MAP balances these competing factors.
Single Player Mode
What if you don’t have a group?
Research suggests that even polling yourself at different times can create a “crowd within.” If you allow three weeks to pass between your estimates, you’ll achieve approximately one-third the value of a second outside opinion. That’s how much “occasion noise” we generate. But there’s a better way to get a new perspective.
In the appendix of Noise, Kahneman lays out a helpful operational procedure he calls Correcting Predictions. It includes making predictions, honoring base rates, and allowing for the powerful force of reversion to the mean.
Let’s use Kahneman’s example to explore. Imagine a four year old girl who was an early reader. What would you predict her GPA would be upon high school graduation? The average guess is 3.8. She’s clearly clever, maybe in the top ten percent at age four. Our gut might tell us the top ten percent fourteen years later would equate to a 3.8 GPA at graduation. Makes sense.
STEP 1: Make an intuitive guess.
This is our fast, automatic “System 1” prediction. Sometimes there’s quality information in that first hunch, especially if we’ve received a lot of feedback and we’re operating in a kind learning environment.9 This would be our intuitive guess of a 3.8 GPA.
STEP 2: Look for the mean.
This is the base rate. Forget what we know about the specific situation. What would the average GPA be for the graduating class? Let’s say it’s 3.2. We’re now incorporating the outside view and honoring potential reversion to the mean. It’s similar to polling a group, but we’re using a statistical base rate to reduce blindspots.
STEP 3: Estimate the diagnostic value of the information you have.
This is difficult. But based on what we know, how helpful is the extra information we have compared to just the vanilla base rate? We’re attempting to quantify the diagnostic value of the information, where zero is totally irrelevant (say, the student’s shoe size) and one is perfectly correlated (perhaps a list of all of her grades in every subject). Shades of gray make the world messy, and real world correlations are all but impossible to untangle. We usually don’t have the explicit answers, like all of her grades.
Let’s assume we believe there’s a 20% correlation between a 4 year old reading and eventual graduating GPA. The other 80% is due to parental influence, her friends, her socio-economic status, and a million other factors, many unknown.
STEP 4: Adjust from the outside view in the direction of your intuitive guess, to an extent it reflects the diagnostic value of the information you have.
This is the simple arithmetic of three numbers. You adjust the mean (from Step 2) toward your intuitive guess (from Step 1), in proportion to the correlation you estimated (in Step 3).
In the case of the student GPA, we’d start with the 3.2 GPA (base rate) and shift it upward by twenty percent toward our 3.8 intuitive GPA estimate.
That would equal a 3.3 GPA. Correcting Predictions is a nice Bayesian blend of base rates and intuition.
Decision Voltron Our last method is my own concoction blending Kahneman’s MAP and Correcting Predictions, which I’ll call Decision Voltron. It’s admittedly a bit cumbersome, but that’s the going price for robustness. Good work is often hard work.
The goal is to integrate the wisdom of the crowds and base rates, without compromising individual integrity. We need a procedure that’s informationally watertight. And for the first time in human history, software allows us to share our views while minimizing the infection rate of biases. Enough preamble…
STEP 1: Figure out what’s important.
What factors are going to move the needle for this decision, policy, investment, etc? With minimum initial discussion, each team member writes down their own assessment of what’s important. They can share their own gut feelings along with supporting explanations. These are recorded individually. This is Kahneman’s MAP.
Individual assessments are collated and shared anonymously with the team. This removes power dynamics and persuasive halo effects. A round of discussion ensues. Kahneman recommends the E-T-E method (Estimate-Talk-Estimate). Do your own work, share it, talk about it, then estimate again. As a team, decide on the three10 factors that will drive the outcome. Rank ordering or a points allocation system can be good ways to pick the team’s top three.
STEP 3: Make an estimation.
Now that the group has narrowed down what’s important, make individual estimations for each of these factors. These intuitive estimations are collected and averaged behind the scenes for now. This would equate to the initial 3.8 GPA estimate of our early reader.
STEP 4: Hunt for base rates.
Each individual goes off hunting for appropriate base rates for each factor. It’s a Bayesian winnowing process to find the closest data we can to describe the situation we’re trying to predict. Write down what you found and why you think it’s an appropriate base.
The “captured” base rates and logic then get collated and shared simultaneously and anonymously with the group.
Conduct another round of Estimate-Talk-Estimate. Average the individual resulting base rates for each of the three factors.
STEP 5: Assign a correlation.
This represents the confidence in our own assessments compared to the base rate. Do we have a special insight or conviction? Are we willing to bet on ourselves or should we defer to the base rate?
Individuals assign their own correlations for the three factors, plus their reasoning. As you might expect by now, these results are then shared anonymously with the team. Discuss the results, then perform another round of estimation. Take the group’s average correlation for each factor.
STEP 6: Calculate the necessary arithmetic to unlock Decision Voltron.
We now have three factors with a wisdom-of-the-crowd-infused estimation, adjusted by the base rate in proportion to the perceived correlations. The math is straightforward. Our estimations around the three factors should allow us to make an informed and well-researched decision.
The miracle of software gives us synchronized, anonymized, non-contemporaneous, collated communication. We’ve removed blindspots, respected base rates, all the while minimizing the biases from information cascades and polarization.
What emerges from this process is as well-vetted a group decision as presently imaginable. That is, until the robots fully take over...
As always, we’re thankful to have such great partners in this wealth creation journey.
Jake


