
What follows below are some charts looking at the EV/EBITDA and subsequent returns in the US market. Charts were presented on 18 December 2018 in our Global FVMR strategy.
Q3 hedge fund letters, conference, scoops etc
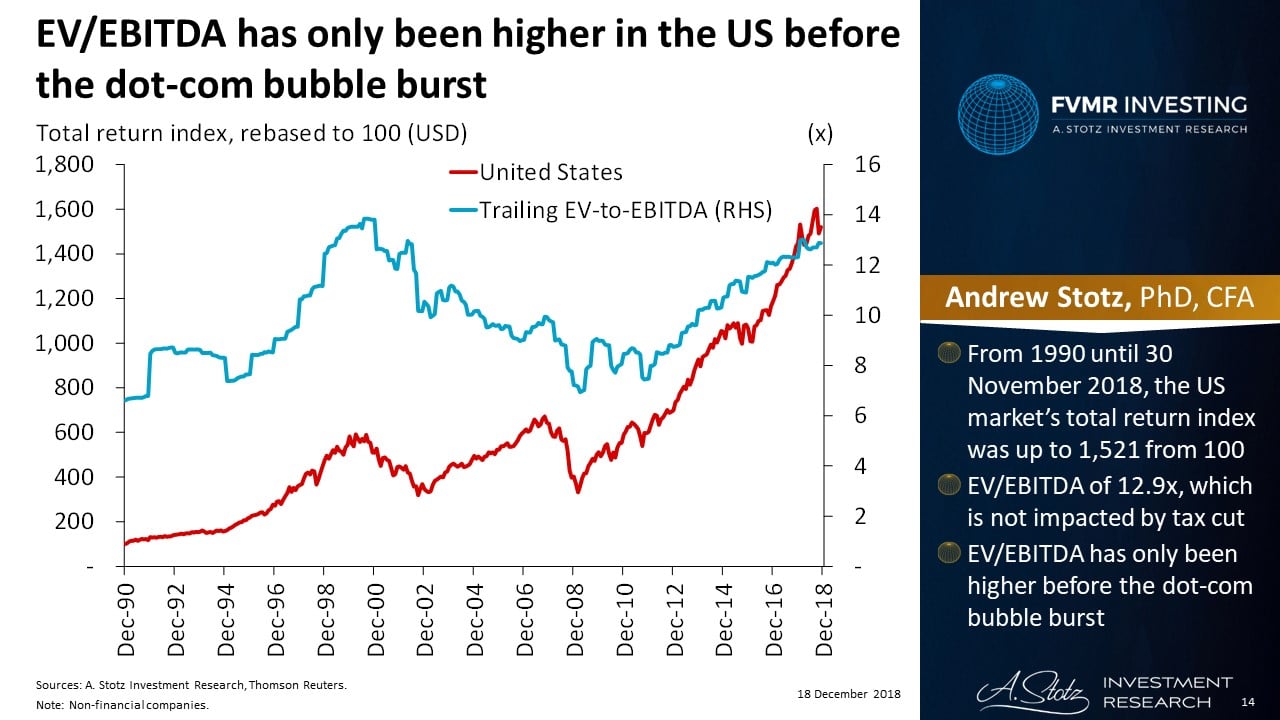
EV/EBITDA has only been higher in the US before the dot-com bubble burst
- From 1990 until 30 November 2018, the US market’s total return index was up to 1,521 from 100
- EV/EBITDA of 12.9x, which is not impacted by a tax cut
- EV/EBITDA has only been higher before the dot-com bubble burst
Low probability of positive subsequent returns at current EV/EBITDA range
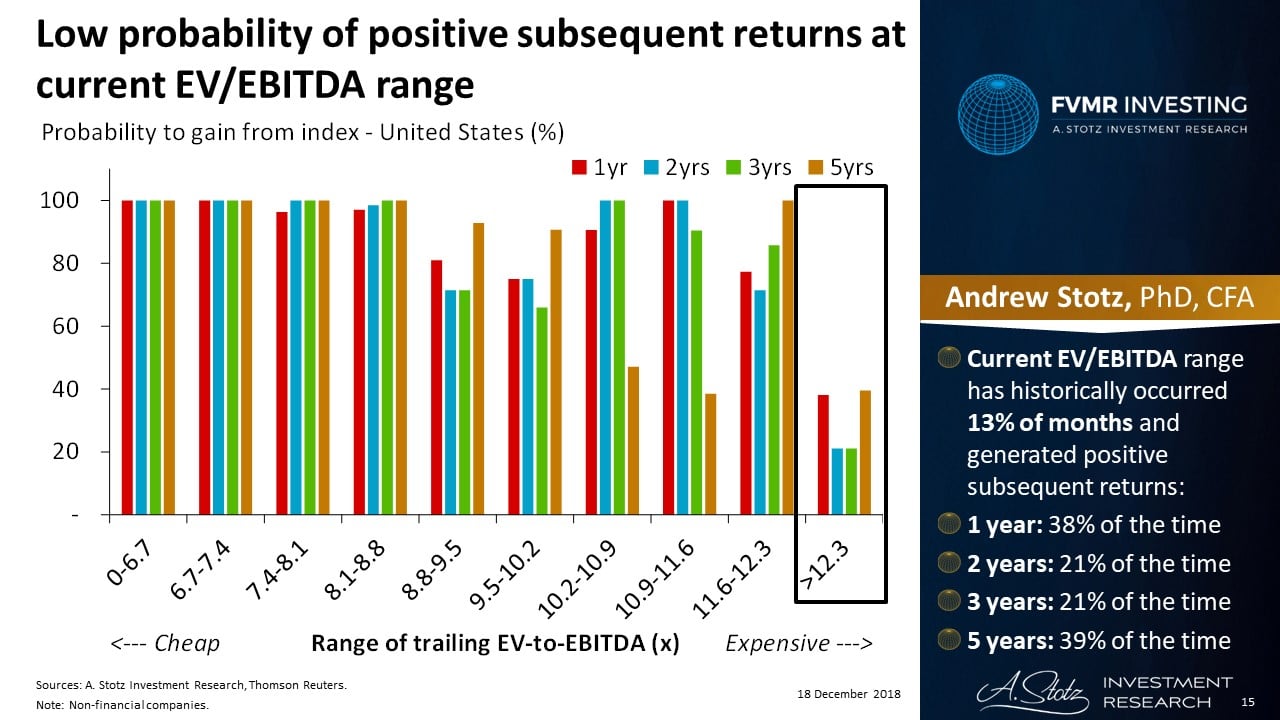
- Current EV/EBITDA range has historically occurred 13% of months and generated positive subsequent returns:
- 1 year: 38% of the time
- 2 years: 21% of the time
- 3 years: 21% of the time
- 5 years: 39% of the time
Historically, EV/EBITDA at this high level has led to negative subsequent returns on average

- Current EV/EBITDA of 12.9x, this range has historically given the following average subsequent returns:
- 1 year: (5%)
- 2 years: (9%) p.a.
- 3 years: (6%) p.a.
- 5 years: 1% p.a.
The US market has traded in cheaper EV/EBITDA ranges 87% of the past 336 months
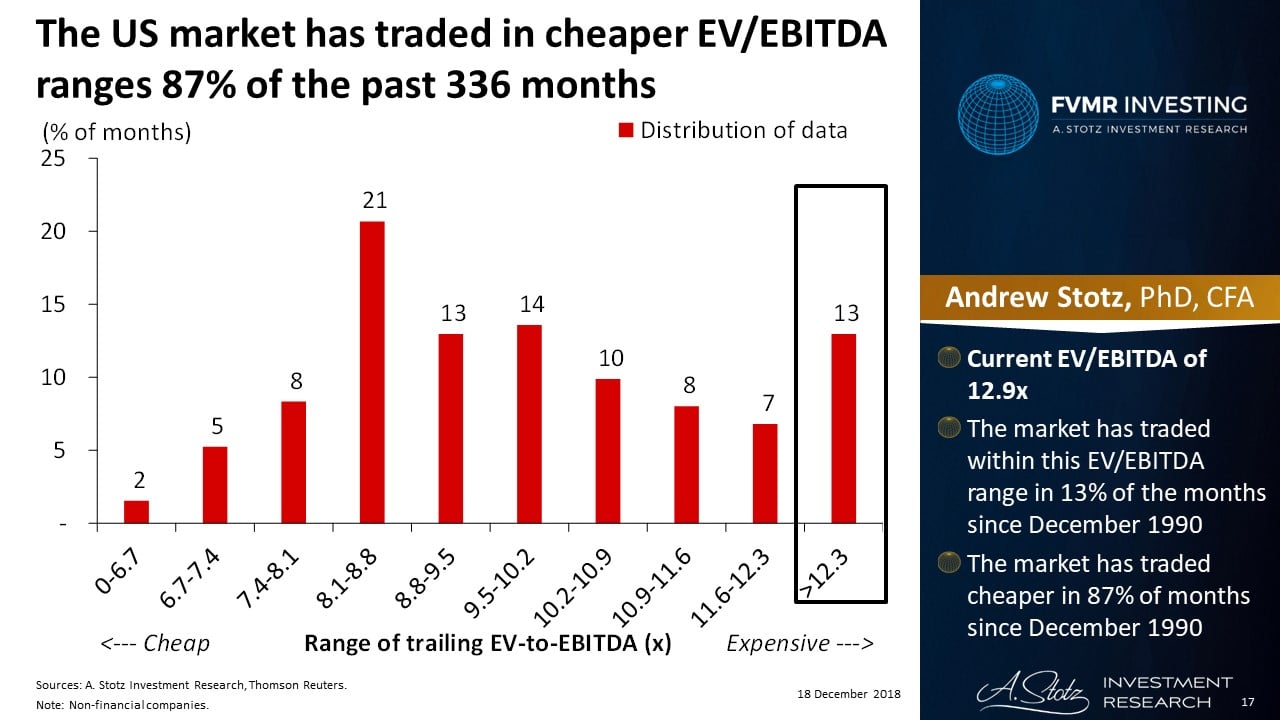
- Current EV/EBITDA of 12.9x
- The market has traded within this EV/EBITDA range in 13% of the months since December 1990
- The market has traded cheaper in 87% of months since December 1990
Article by Become A Better Investor


