2017 Hedge Fund Letters
- Currency and credit bubbles in China
- Housing bubbles in Australia and Canada
- Debt-to-GDP bubbles in Europe and Japan
- Worldwide gluts in industrial commodities including fossil fuels, iron ore, and steel
- Investment philosophy bubbles: passive vs. active; long vs. hedged
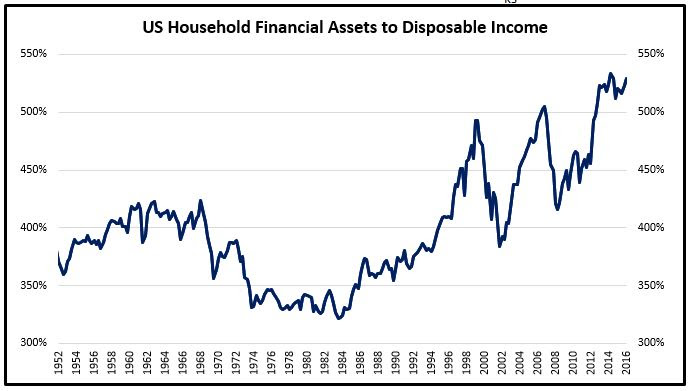
Source: Federal Reserve
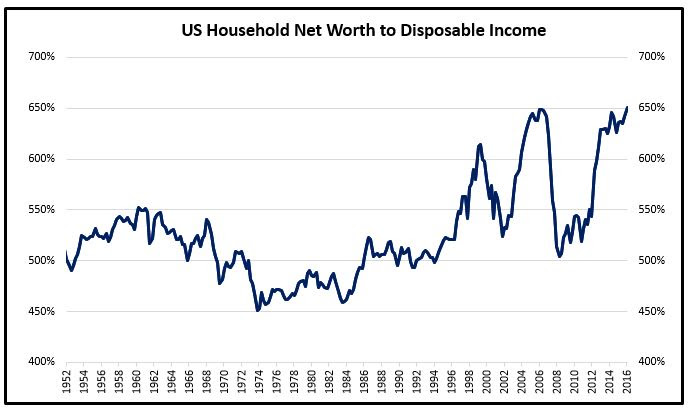
Can these bubbles get bubblier before they burst? Sure. The valuation charts above are through the end of 2016. They broke out to new highs theoretically intra-quarter with the stock market rally through March 1. Remember the dot-com and US housing bubbles? We have recently just reached valuation levels that surpass those. While valuations could go even higher, there is also a chance that US stocks already peaked on March 1, the day after President Trump’s state of the union address.

Bubbles implode when central banks set out in earnest to raise interest rates! Investors need to realize that both the US and Chinese central banks are now in interest-rate-hiking cycles. The risk to equities is that the S&P 500 Index is at record levels in terms of median price-to-sales as well as median non-bank corporate leverage. Bonds and cash are also near record valuation levels. What could go wrong? Does the Trump administration and the Fed really have this under control? How about President Xi and the PBOC?
Thus, we are bears. As bears, our short equity positions have held us back year-to-date in our hedge funds, because the bubbles have not burst yet. We believe equity shorts will be coming in handy soon enough. The global economic growth cycle has been remarkably still intact, but for how much longer? We have had long equity positions too in our hedge funds to ride the late innings, so at least we have not been getting hurt too badly. Our hedge funds have been hedged and after today are modestly net short. Our long-only strategy has been doing great. It is being hedged with fundamentally sound long positions, precious metals, cash, and a willingness to sell and raise more cash.
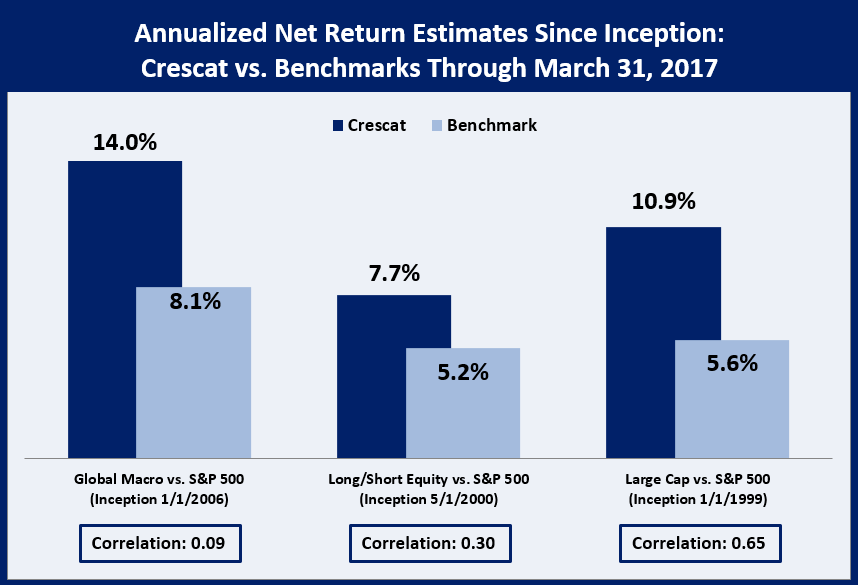
We aim to grow and protect investor capital by following our well-developed discipline of combining our proprietary equity fundamental quant model with macro themes and risk models. The goal is to successfully navigate the global economic cycle and thereby produce superior long-term, net risk-adjusted returns to clients in all three of our products.
Crescat Global Macro: -0.5%
Crescat Long/Short: -2.1%
Crescat Large Cap: -0.2%
YTD Net Performance Estimates (through 3/31/2017)
Crescat Global Macro: -3.6%
Crescat Long/Short: -1.7%
Crescat Large Cap: +5.4%
Sincerely,
Crescat Capital


