Home Info-Graphs Chemical Activity Indicates Further Market Gains [INFOGRAPHIC]

Chemical Activity Indicates Further Market Gains [INFOGRAPHIC]

When you purchase through our sponsored links, we may earn a commission. By using this website you agree to our T&Cs.

“Davidson” submits:

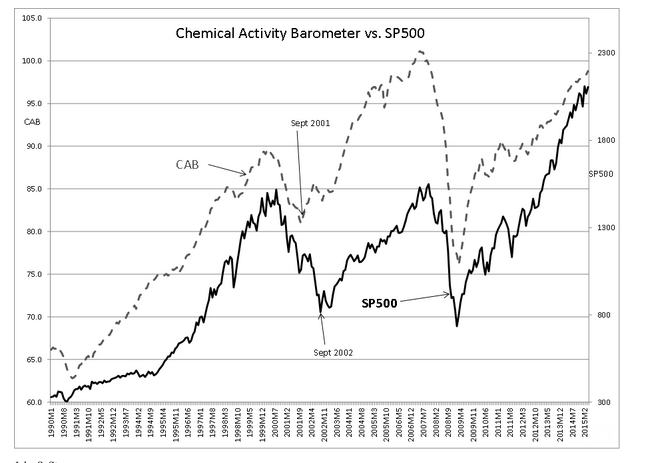
The Chemical Activity Barometer(CAB) was reported at 98.8. The relationship between the CAB and the SP500  is displayed in the chart below. While market psychology is the determinant of securities’ pricing, the long term determinant of market psychology across the business cycle has been economic activity. For this reason, the CAB has been a good indicator of the direction of equity prices the next 18mos-24mos when used in conjunction with other economic indicators.

The continued uptrend in the CAB is positive for equities based on history.

Chemical Activity

Our Editorial Standards

At ValueWalk, we’re committed to providing accurate, research-backed information. Our editors go above and beyond to ensure our content is trustworthy and transparent.

valueplays
Editor

Want Financial Guidance Sent Straight to You?

  • Pop your email in the box, and you'll receive bi-weekly emails from ValueWalk.
  • We never send spam — only the latest financial news and guides to help you take charge of your financial future.