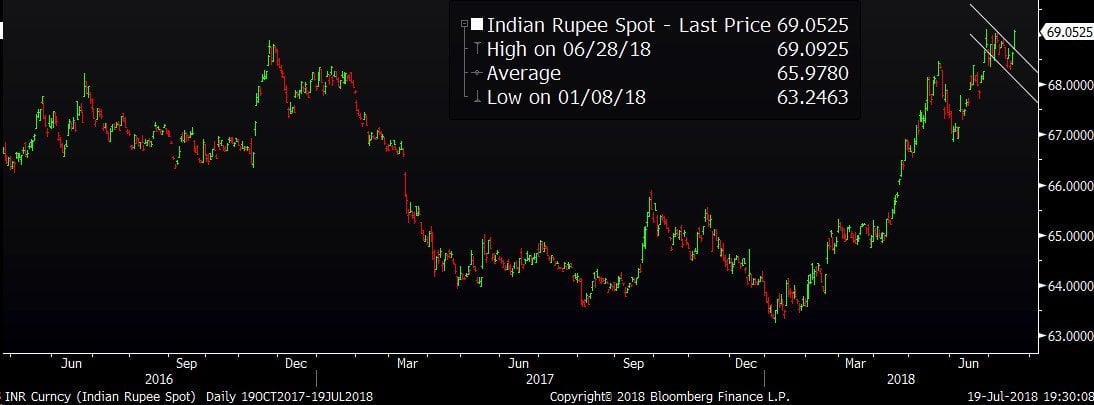
1. Indian Rupee Closes at its weakest level on record of 69.05/$. Interestingly it has also broken out on chars. I am medium term (1-3 years) bearish on Rupee simply because Capital flow favors Dollar over INR.

Q2 hedge fund letters, conference, scoops etc
2. Country ETFs, % Below All-Time High…India: -11%,China: -26%,US: -1%. India and US both put a low in last week of January but US has bounced back whereas India ETF is still down. Japan put a high in 1996 a level which is yet to surpassed …. what a wealth destruction

3. Decline of Competition
Firms do not even talk about competition anymore. This chart from the Economist shows that in annual reports, companies have less and less need to discuss competition from other firms which is strange
4. Percent gains required to offset losses. This is why losses hurt lot more than Profits
5. Almost Monopolies
The market cap of the top 5 S&P 500 companies: $4,095,058,706,432
The market cap of the bottom 282 S&P 500 companies: $4,092,769,755,136

Article by Ritesh Jain, World Out Of Whack