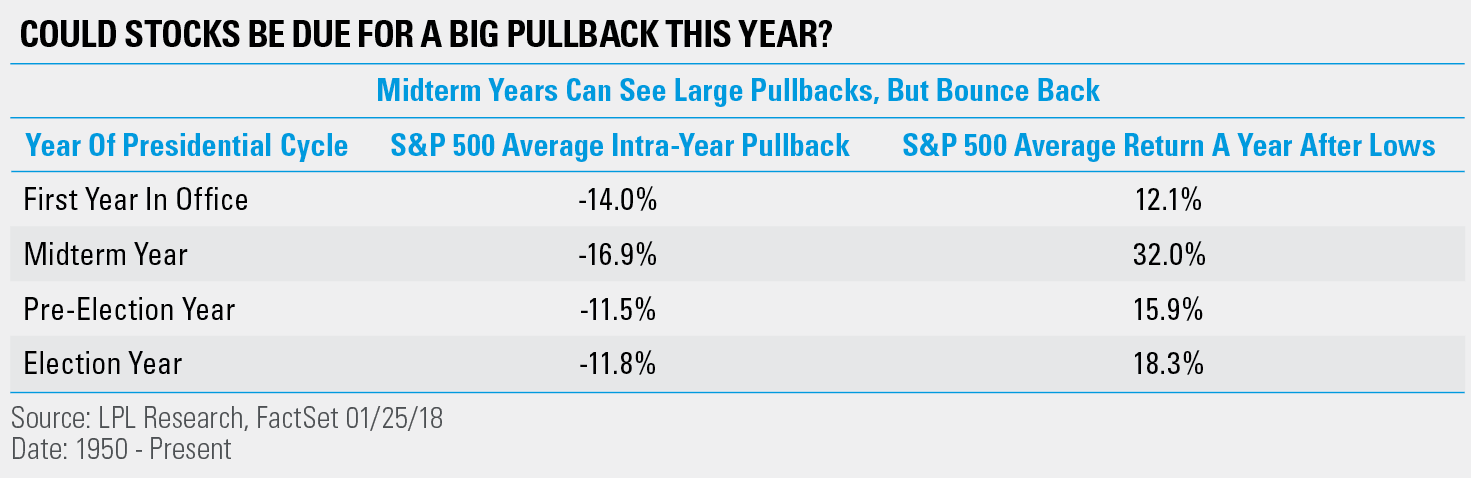
Equities were met with tremendous success during the first year of President Trump’s term, but now we’re headed into the much more historically troublesome midterm year. As Ryan Detrick, Senior Market Strategist notes, “Midterm years tend to be a banana peel for markets, as they see the largest pullbacks out of the four-year presidential cycle. However, those who hang on for the ride tend to see a significant bounce over the next year.”
Taking a closer look, since 1950, the S&P 500 Index has been down 16.9% on average at its intra-year low during midterm years, though it tends to bounce back, posting an impressive 32.0% average gain over the subsequent twelve months.*
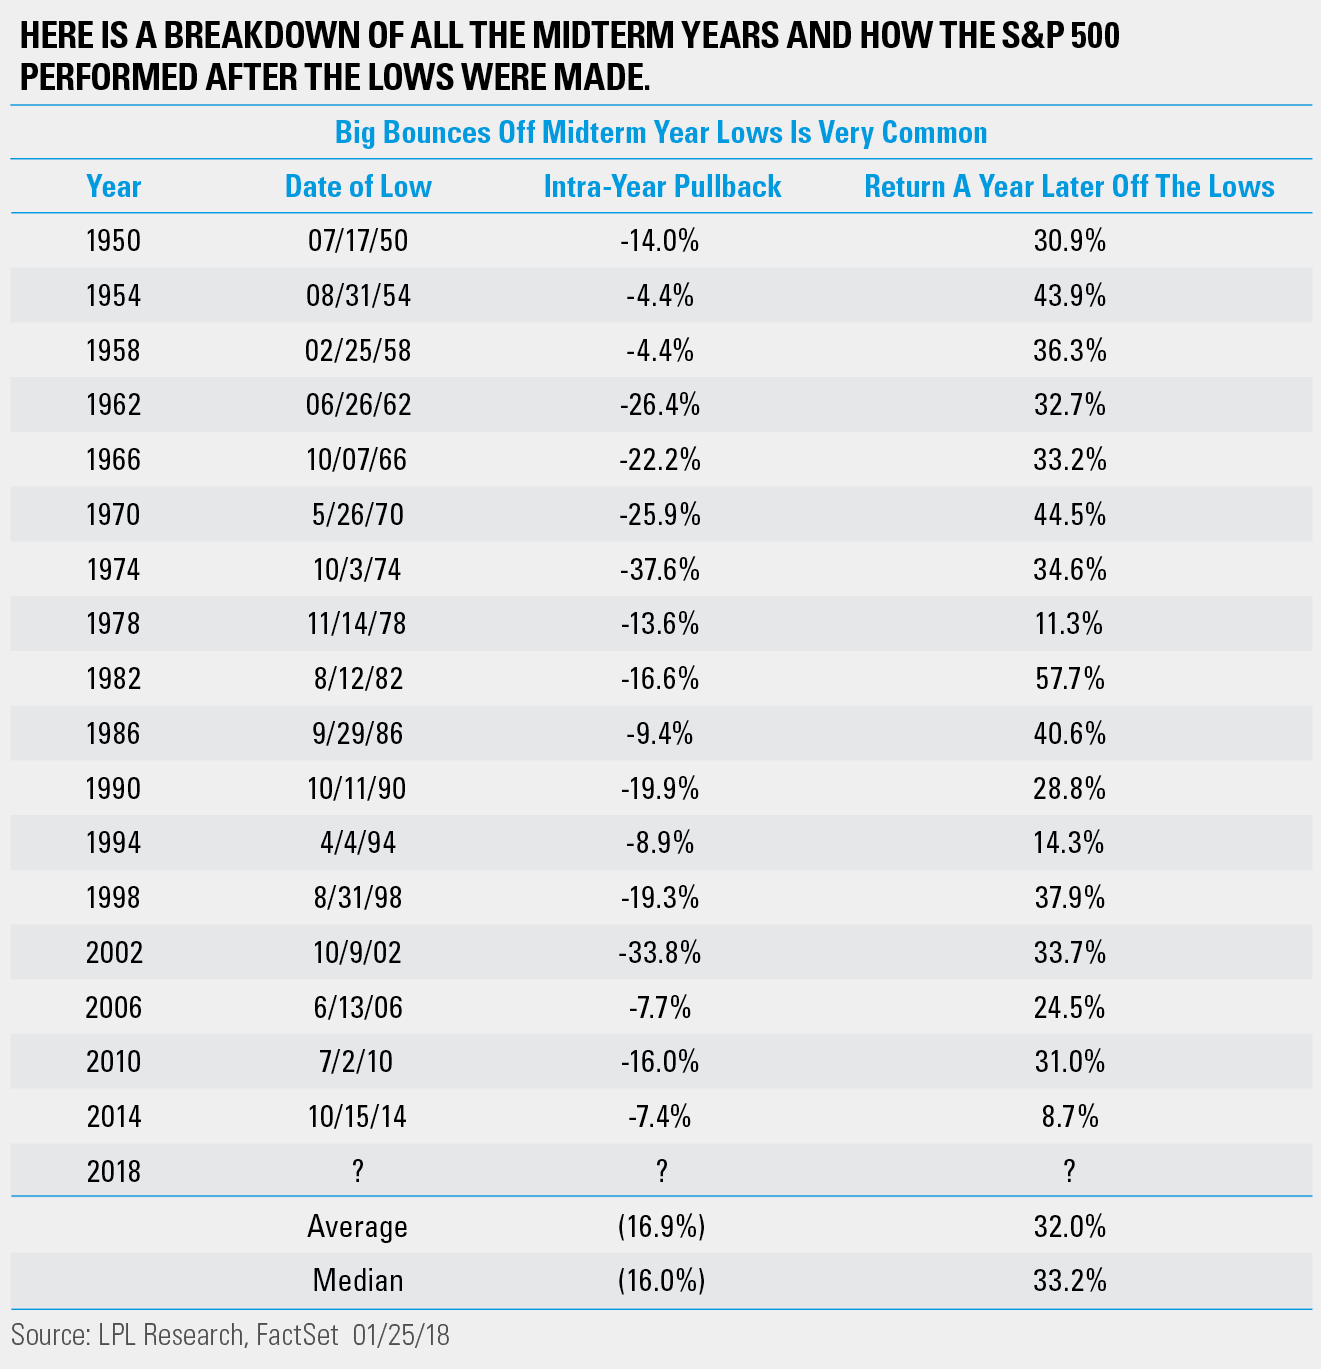
Now take a look at all of the midterm years and how the S&P 500 performed after the intra-year lows were made:
The action over the past year has been historic on many levels, but we have our concerns as the bull market continues to move higher. In our next Weekly Market Commentary, due out later today, we will list some of the amazing streaks which make the recent market action truly special, but we will also look at a few other potential near-term worries which could trigger some long overdue volatility.
Article by LPL Research