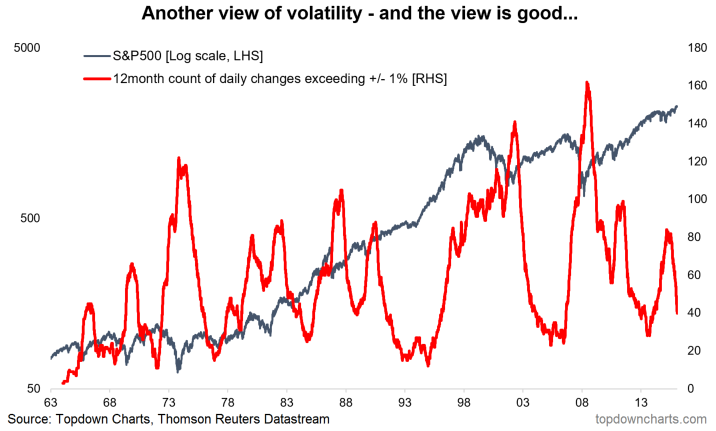
This article takes an alternative view on volatility. Rather than the usual CBOE VIX – a volatility index derived from option pricing, the metrics below look at actual changes in prices. The index looked at is theS&P500(will have a look at a few other indexes later). The first chart shows the rolling 12 month count of days where the daily percent change exceeded +1% or was worse than -1%. The resulting indicator provides some interesting insights and potential signals…
Follow us on LinkedInhttps://www.linkedin.com/company/topdown-charts
What sticks out to me is that the indicator rises into a correction or bear market and peaks at the bottom of the market e.g. 2016 bottom, 2011, 2009, 2003, and so-on. What’s also interesting is when the indicator rolls over and heads below 50. Usually this happens when a bull market gets under way. We’re seeing exactly this pattern right now.
It also highlights that there are two types of bull markets: a bull market where volatility rises (an erratic bull market), and a bull market where volatility falls and stays low (a steady bull market). At present we appear to be in the middle of a steady bull market, and these can go on for quite some time.
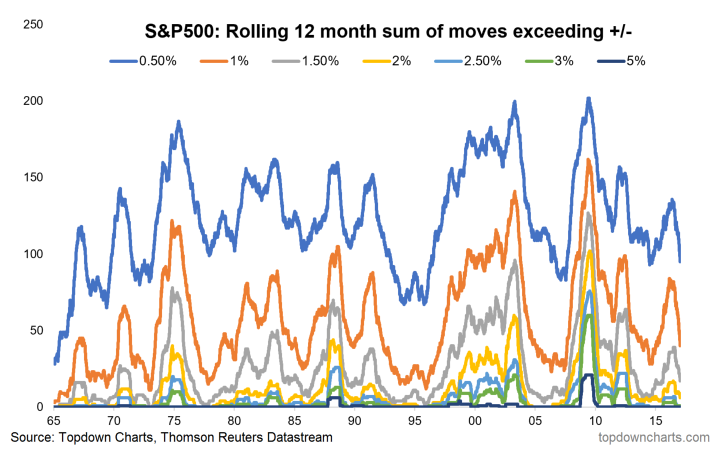
Finally, it’s worth a quick look at the spectrum of moves. The following graph looks at the same indicator but for various different threshold magnitudes e.g. 0.5% and 5%. It gives a further insight into how erratically a market is moving… just compare and contrast 2008 with 2005.
Taking alternative views of markets and economies is important. AtTopdown Chartsthere is an emphasis on innovation, coming up with new indicators and new ways of analyzing the market as well as refining and leveraging our existing indicator set.
The analysis in today’s article shows how another view of volatility can yield insights into how the market is behaving and give clues as to how it might evolve in the future. At present the clues point to a steady bull market following the 2016 bottom.
Follow us on:
LinkedInhttps://www.linkedin.com/company/topdown-charts
Twitterhttp://www.twitter.com/topdowncharts


