In a discounted cash flow valuation, the value of an asset is the present value of the expected cash flows, with the equation written as follows:
Note that r1 is the discount rate for year 1, r2 is the discount rate in year 2 and so on until your get to your terminal value and the discount rate in perpetuity is rN. There is one minor computational detail which can have major valuation effects. Note that, in the presence of time varying discount rates, the way we do discounting changes. Rather than discount back each year’s cash flow at that year’s discount rate, we compute a compounded discount rate in earn period. Thus, if your cost of capital is 12% in year 1, 11% in year 2 and 10% in year 3, the present value of $100 million in year 3 is as follows:
While this is true for all companies, the effect will be greater when you are valuing young companies or companies in transition, where you expect large changes in the company as you move through your forecast period. Thus, in my valuations of Uber in 2014 (a young growth company) and Tesla in July 2016 (a growth company in transition) & Apple in 2016 (a mature company with solid cash flows), my discount rates changed over time.
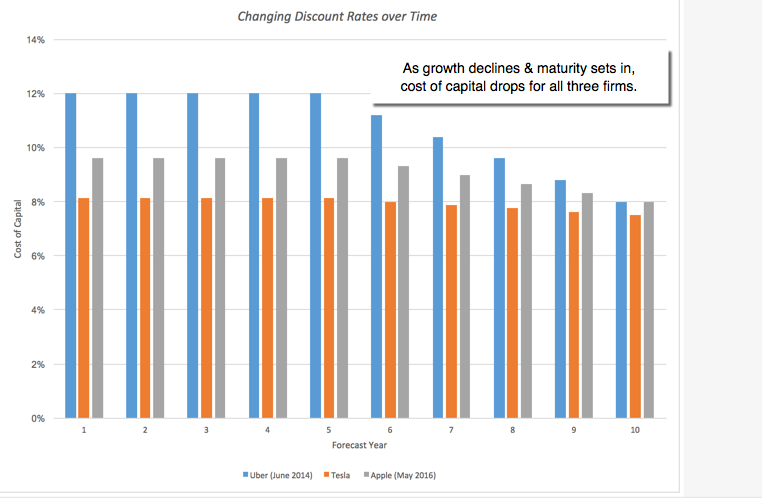
How much do these changing discount rates affect the values per share? Considerably, as can be seen in the graph below where I contrast the values that I would have obtained for the three companies with my default assumption of changing discount rates with the values that I would have obtained if the discount rates had been left at the starting levels.
| Value with time-varying Discount Rate | Value with constant discount Rate | Effect on value | |
|---|---|---|---|
| Uber (June 2014) | $5,895 | $3,601 | -38.91% |
| Tesla (July 2016) | $22,364 | $17,688 | -20.91% |
| Apple (May 2016) | $692,852 | $633,336 | -8.59% |
With Uber, the effect on value is substantial, increasing the value of equity by almost ___ but with Apple, the effect is more muted.
- To estimate the cost of capital that you will use in the early years (years 1 and 2), start with the current cost of capital for the firm. That will reflect the existing business mix for the firm (in the beta), the geography of its revenues (in the equity risk premium) and the debt policy for the firm (in the cost of debt and debt ratio).
- If the company has clearly specified plans to change its debt ratio and business mix in the near term, adjust the cost of capital for these changes in the near years (years 3-5) for these changes. If it does not, leave the cost of capital at the current level.
- The cost of capital in steady state (for terminal value) should move towards those of mature firms. If you see your firm growing across multiple businesses, that cost of capital should be that of the market (with a beta of one, a debt ratio close to the market average) but if you see it growing within only its existing business, the cost of capital should be reflecting of the industry average (reflecting the industry average beta and debt ratio).
- In the transition period (between the near years and steady state), you should adjust the cost of capital from your near-year level to stable growth levels, using linear increments.
| Phase | Forecast years | Beta | Equity Risk Premium | Debt Ratio | Cost of debt |
|---|---|---|---|---|---|
| Start of valuation | Yr 1-2 | Reflects current business mix | Current geography of operations | Current market debt ratio | Current bond rating or default risk assessment |
| Build up | Yrs 3-5 | Changes in business mix (if any) | Changes in geography (if any) | Targeted debt ratio (if any) | Default risk, given new debt ratio |
| Transition | Yrs 6-10 | Move incrementally to stable period beta | Adjust to stable period ERP | Adjust to stable period debt ratio | Adjust to stable period cost of debt |
| Stable growth (Steady State) | Year 10 & beyond | Move to 1, if company grows across businesses, or to industry average, if it stays within business | Steady state geographic exposure and equity risk premium estimates for long term. | Market-average debt ratio (if growth across businesses) or industry-average debt ratio (if single business) | Stable company cost of debt |
One reason that I compute the costs of capital, by industry grouping, and update it each year is to have access to this information whenever I value a company. If you are interested, you can find the industry average costs of equity and capital for US firms and global firms on my website.
One reason that analysts often feel helpless, when computing intrinsic value in a DCF, is because they feel that they not only have little control over the discount rate, since all the inputs come from outside, but that they are stuck with this discount rate forever. If your discount rates adjust over time to reflect changes in your company, towards industry or market averages, these rates will start to have a smaller effect on your valuations and that is not only healthy but more realistic (at least in my view).
YouTube Video
Attachments
- Costs of equity & capital by industry: US companies
- Costs of equity & capital by industry: Global companies
DCF Myth Posts
Introductory Post: DCF Valuations: Academic Exercise, Sales Pitch or Investor Tool
- If you have a D(discount rate) and a CF (cash flow), you have a DCF.
- A DCF is an exercise in modeling & number crunching.
- You cannot do a DCF when there is too much uncertainty.
- It’s all about D in the DCF ( Myths 4.1, 4.2, 4.3, 4.4 & 4.5)
- If most of your value in a DCF comes from the terminal value, there is something wrong with your DCF.
- A DCF requires too many assumptions and can be manipulated to yield any value you want.
- A DCF cannot value brand name or other intangibles.
- A DCF yields a conservative estimate of value.
- If your DCF value changes significantly over time, there is something wrong with your valuation.
- A DCF is an academic exercise.